Variable mail platform
Role
Product Designer
Timeline
6 months
Deliverable
MVP
Tags
B2B SaaS
No-code
If/Then rules
I designed a B2B platform for building and tracking variable, personalised mail: a no-code editor with six component types plus performance dashboards. The same product had to serve everyone from a non-technical small-business owner to a developer integrating by API. I anchored the editor on one idea, composing mail from conditions rather than code, so the least technical owner can personalise every mail piece without waiting on a developer.
Decisions
D1
A visual rule builder
Making mail vary by recipient is normally a scripting job most creative teams can't take on. The builder turns it into a sentence they fill in: If field, Then change content.
The whole rule, filled in like a sentence.
D2
One rule grammar, a reusable component library
Raw uploads (images and datasets) sit in Assets; the parts you compose with are Components, each saved with its own rules and reused across mailers. All six types answer to the same If/Then builder, so a creative learns one pattern and applies it to a headline, an image, a link or a QR.
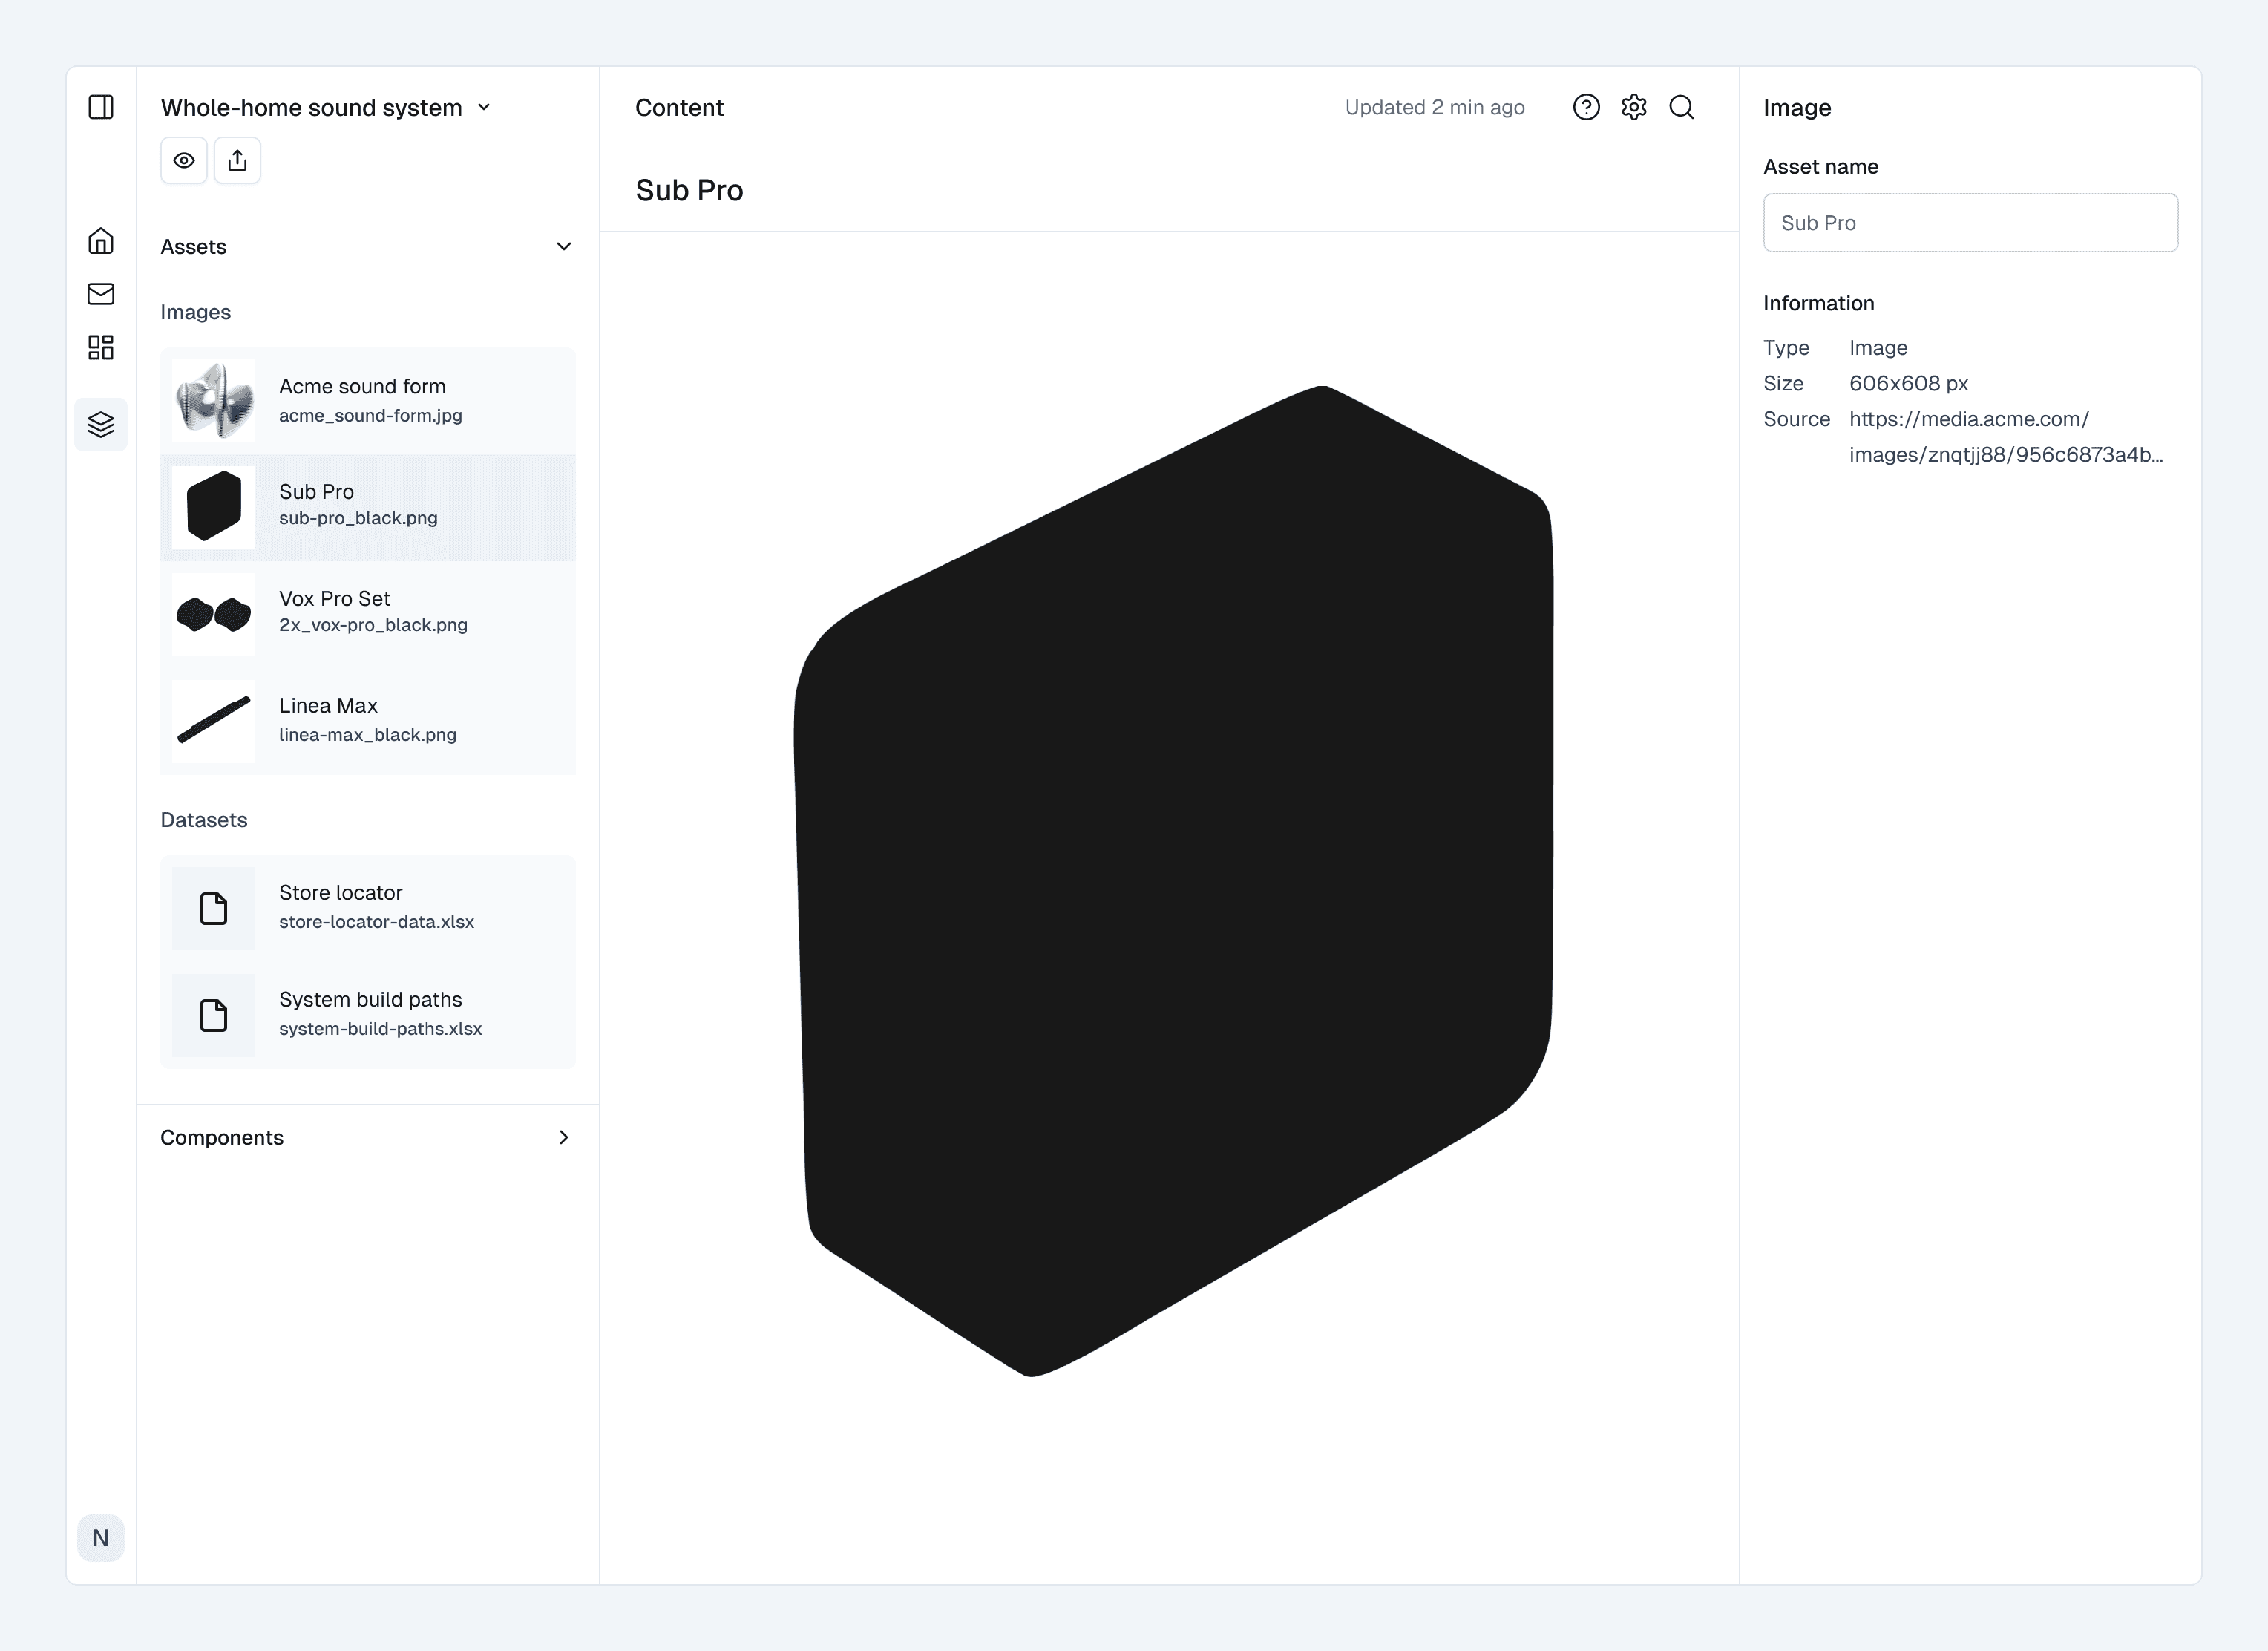
Assets: raw uploads, images and datasets.

Components: rule-bearing parts, by type.
D3
Data-bound components start from a dataset
Map and chart work unlike the value-swap types. Each binds an uploaded dataset first, then rules layer on: a "Closest store" map reads the store-locator file, and a chart stays locked until a data source sets its default. The rule model holds; the content is a whole table, so you point the component at data before shaping it.

Empty until a source is set.

The Closest-store map plots its dataset.
D4
Default + stacked rules for safe fallthrough
When a recipient matches no rule, the component can render blank with nothing to flag it. A required Default sits under each component's ordered rules, so unmatched recipients always land on the Default.

Rules run in order; the Default catches the rest.
D5
Mailers and Dashboards kept as separate homes
Both show performance, so they could have merged. I kept them apart: Mailers lists one row per mail piece and drills into that piece's metrics and API details, while Dashboards works across every mailer at once, with saveable views.

Mailers drills into one piece.

Dashboards spans them all.
D6
Widgets begin with the metric
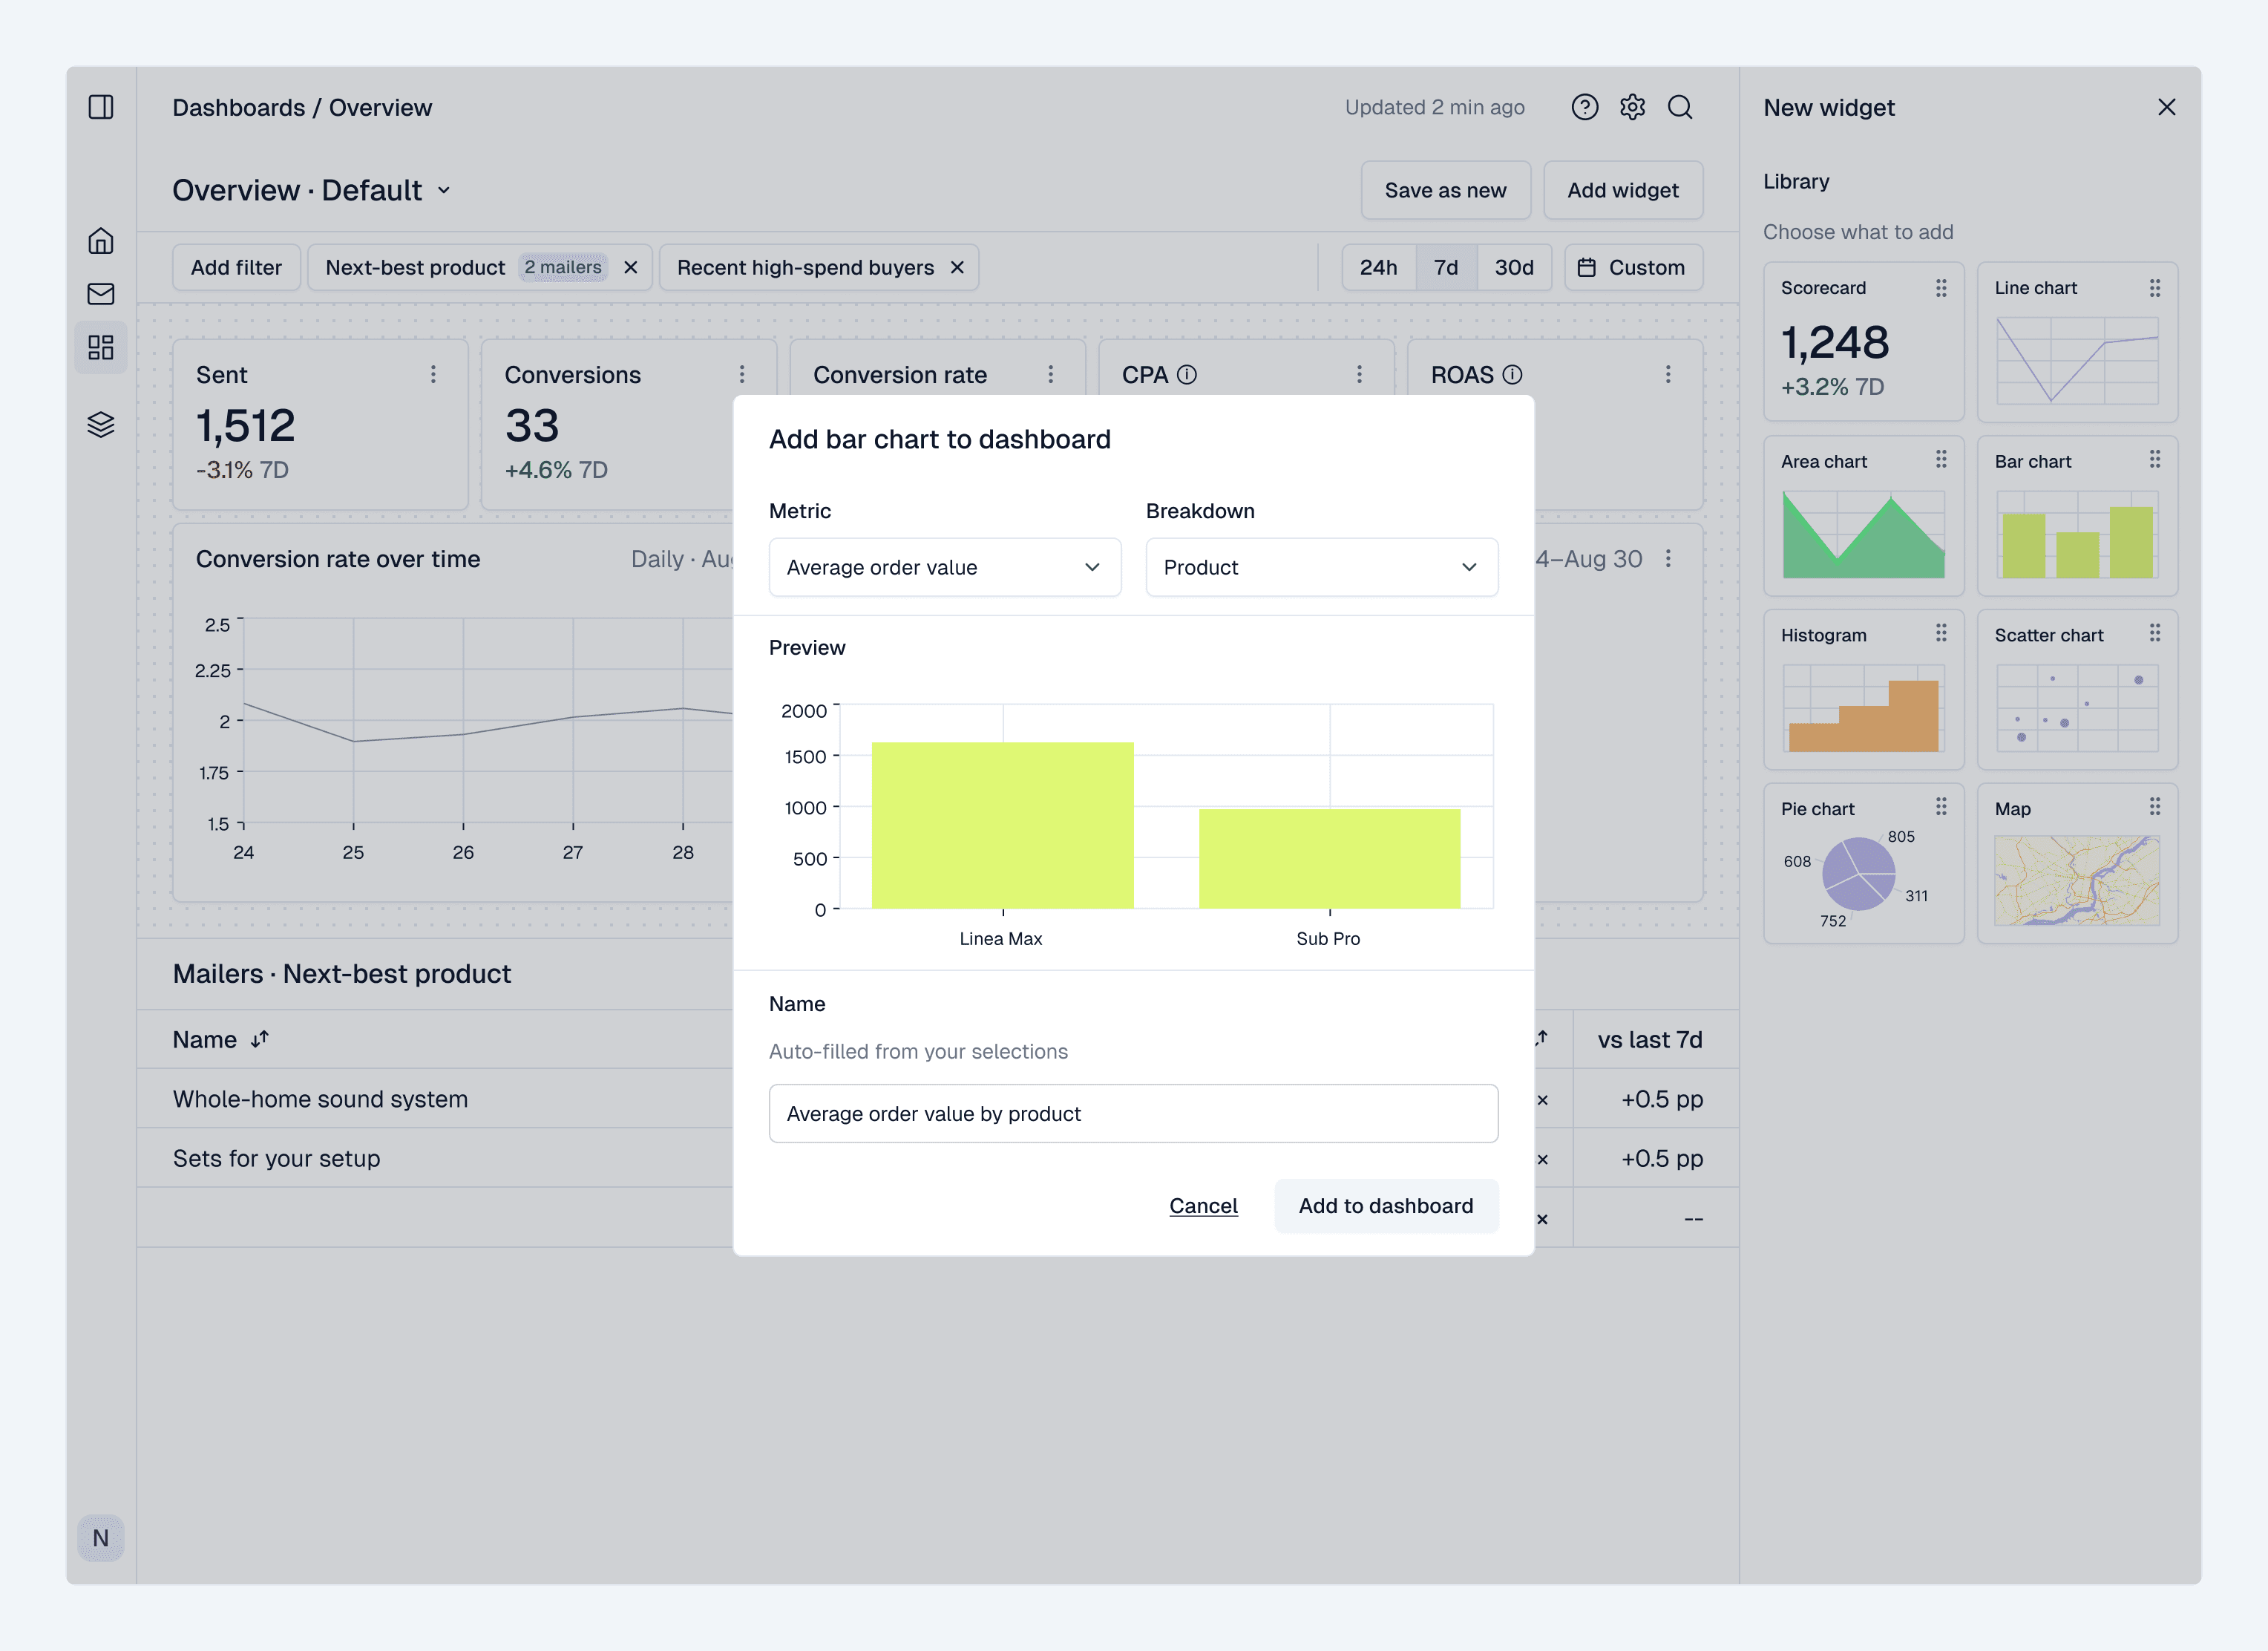
An earlier version of this panel led with chart type: you committed to a bar chart before knowing whether it fit the question. The final panel starts from the metric, breakdown, and comparison; the chart and its name fill in, with a live preview. It suits someone who knows the number they care about.
Before: the chart type chosen first.
After: pick the metric; the chart fills in.
D7
Developers and creatives share one mailer
The mailer exposes an API-ready view (ID, required variables, proof) for developers and an "Edit content" door into the editor for creatives, without forking into two products.

The API view for developers, Edit content for creatives.
Results
The same mailer can run end to end: a creative builds it, the dashboards show how it performs, and a developer sends it through the API.